
When a VPS becomes slow, the real cause is almost always one of four bottlenecks: CPU, RAM, disk I/O, or network. This guide shows a repeatable workflow to find the bottleneck quickly using htop, iostat, and atop (plus a few fast “sanity check” commands).
For production workloads, stable monitoring starts with predictable resources. Choose a reliable Linux VPS with enough CPU/RAM and fast storage so your services and diagnostics remain responsive under load.
Open a terminal (macOS/Linux) or an SSH client (Windows Terminal / PuTTY) and connect to the server. Replace username and SERVER_IP with your values.
ssh username@SERVER_IPIf you use a custom SSH port (example: 2222):
ssh -p 2222 username@SERVER_IPAll commands below are executed inside this SSH session.
Before opening full-screen tools, run a few fast commands. They help you understand whether the issue is CPU, memory pressure, disk saturation, or something obvious like a full filesystem.
uptime
free -h
df -h
ps aux --sort=-%cpu | head -n 10
ps aux --sort=-%mem | head -n 10
How to interpret quickly:
uptime: check load average (1/5/15 minutes). If load is consistently far above the number of vCPUs, the system is overloaded.free -h: if RAM is tight and swap is actively used, latency and “freezes” are common.df -h: if a filesystem is 100% full, many services break in strange ways (databases, logs, uploads).Debian/Ubuntu:
sudo apt update && sudo apt install -y htopCentOS / RHEL / AlmaLinux / Rocky (some systems may require EPEL first):
sudo dnf install -y htop || sudo yum install -y htophtop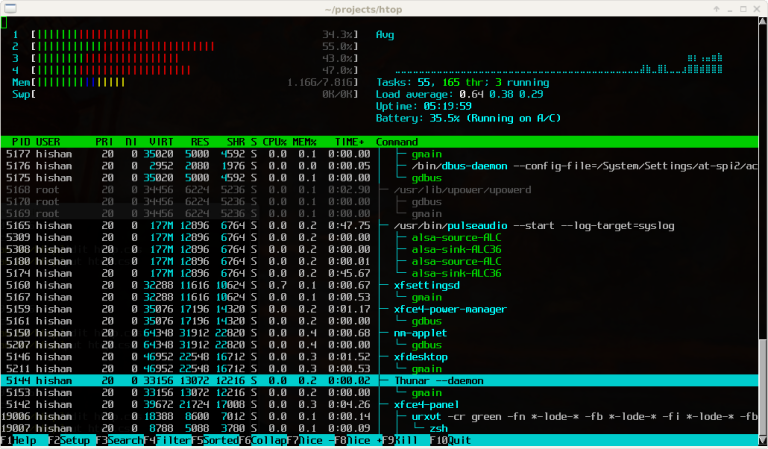
%CPU or %MEM to identify top consumers.%CPU to find CPU-heavy processes.%MEM to find memory consumers.iostat.q.If CPU and memory look normal but the server is still slow, disk I/O is a very common hidden bottleneck (database writes, logs, backups, overloaded storage).
Debian/Ubuntu:
sudo apt update && sudo apt install -y sysstatCentOS / RHEL / AlmaLinux / Rocky:
sudo dnf install -y sysstat || sudo yum install -y sysstatiostat -x 5 3Parameters:
-x — extended statistics5 — interval (seconds)3 — number of reports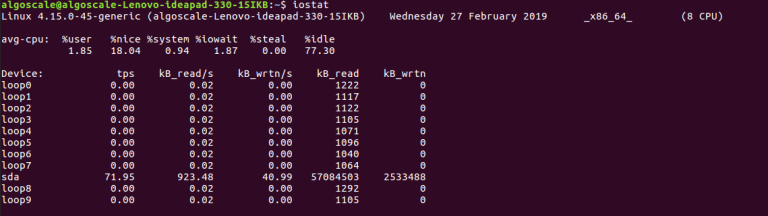
await: average wait time for I/O requests. Large values (tens/hundreds of ms) during load often mean storage saturation.%util: disk busy time percentage. If it stays near 80–100%, the disk is a bottleneck.r/s, w/s, rkB/s, wkB/s: how many operations and throughput you’re pushing.Pro tip: If you suspect “one process is killing disk,” add iotop to your toolbox:
sudo apt install -y iotop || sudo dnf install -y iotop
sudo iotop -oPaatop is great when you need the full picture in one interface: CPU, RAM, disk, and network, plus per-process resource usage.
Debian/Ubuntu:
sudo apt update && sudo apt install -y atopCentOS / RHEL / AlmaLinux / Rocky (often via EPEL):
sudo dnf install -y atop || sudo yum install -y atopsudo atop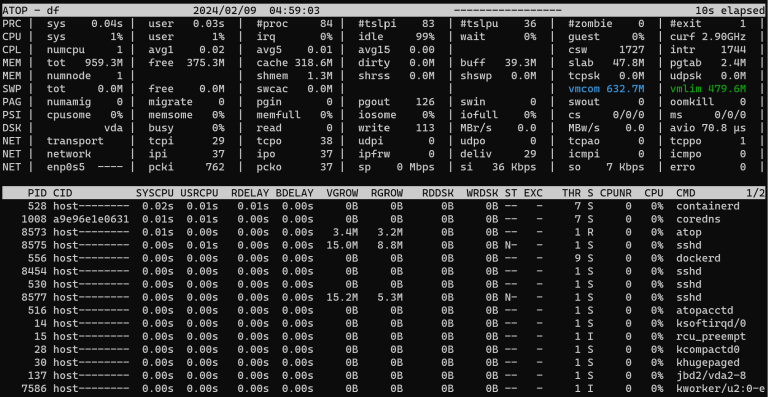
iostat.Exit atop with q.
Sometimes “slow” isn’t load — it’s network saturation, too many connections, or a service stuck behind timeouts. These commands help validate network conditions.
ss -s
ss -tulpn | head
ip -s link
ping -c 5 1.1.1.1
If you need real-time throughput view:
sudo apt install -y nload || sudo dnf install -y nload
nload
Tip: A very common “hidden” issue is a sudden spike in connections (bots, scraping, brute-force). If you see abnormal connection counts, consider rate limiting and security hardening.
To make Linux VPS load monitoring reproducible, save a simple script that collects key metrics (CPU/memory, top processes, disk I/O snapshot, filesystem usage, and connection summary).
sudo nano /usr/local/sbin/vps-healthcheck.shPaste the script below:
#!/usr/bin/env bash
set -euo pipefail

echo "=== TIME ==="
date
echo

echo "=== UPTIME / LOAD ==="
uptime
echo

echo "=== CPU / TOP PROCESSES ==="
ps aux --sort=-%cpu | head -n 10
echo

echo "=== MEMORY ==="
free -h
echo

echo "=== TOP MEMORY PROCESSES ==="
ps aux --sort=-%mem | head -n 10
echo

echo "=== DISK USAGE ==="
df -h
echo

echo "=== DISK I/O (iostat snapshot) ==="
if command -v iostat >/dev/null 2>&1; then
  iostat -x 1 2
else
  echo "iostat not installed (install sysstat)."
fi
echo

echo "=== CONNECTION SUMMARY ==="
ss -s || true
echo

echo "=== LISTENING PORTS (top) ==="
ss -tulpn 2>/dev/null | head -n 20 || true
echo
Make it executable and run it:
sudo chmod +x /usr/local/sbin/vps-healthcheck.sh
sudo /usr/local/sbin/vps-healthcheck.shIf monitoring shows that CPU, RAM, or disk I/O is near the limit most of the time, it’s often more reliable to scale resources rather than constantly fighting symptoms. A more powerful Linux VPS with faster storage and more headroom can eliminate bottlenecks, reduce latency, and make your services stable during peak traffic.
Linux VPS load monitoring becomes easy when you follow a consistent flow: htop for CPU/RAM, iostat for disk I/O, and atop for the full overview. Capture metrics during real load, identify the bottleneck, and then decide whether you should optimize the application/database or upgrade your VPS resources.