

Slow RDP sessions, lagging applications, and “random freezes” on Windows VPS are usually caused by one of four bottlenecks: CPU, RAM, disk latency, or network. This guide shows a practical workflow to measure performance objectively and apply safe optimizations.
If your workloads need stable I/O and predictable latency (IIS, RDS, SQL, 1C, file services), start with a reliable Windows VPS or choose a plan from our VPS hosting lineup.
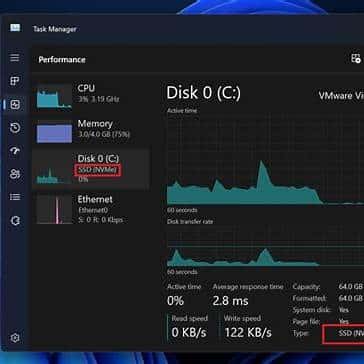
Step 1: Open Task Manager → Performance and check CPU, Memory, Disk, Ethernet. For disk issues, focus on Active time and Average response time.
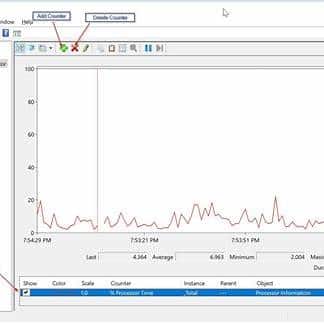
Step 2: Run perfmon.msc → Performance Monitor → click + and add baseline counters:
Collect for 1–5 minutes (Data Collector Set) during the slowdown to capture real bottlenecks.
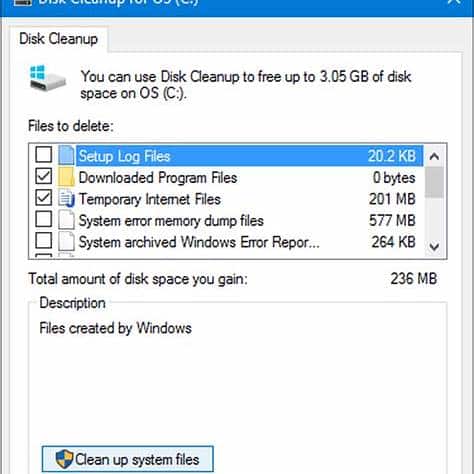
Low free space and uncontrolled temp/log growth can seriously degrade performance and break updates.
GUI method: Drive C: → Properties → Disk Cleanup → Clean up system files (Windows Update Cleanup, temp files, Recycle Bin, etc.).
Command method (safe baseline, may take time):
Dism.exe /Online /Cleanup-Image /StartComponentCleanupToo many startup apps and scheduled tasks can slow login and steal resources.
# List startup items (registry + startup folders)
Get-CimInstance Win32_StartupCommand | Select-Object Name, Command, Location, User | Format-Table -Auto

# List enabled scheduled tasks (high-level)
Get-ScheduledTask | Where-Object {$_.State -ne 'Disabled'} | Select-Object TaskName, TaskPath, State | Sort-Object TaskPath, TaskName | Select-Object -First 50
Recommendation: disable only what you understand. Measure “before/after” with PerfMon so changes are evidence-based.
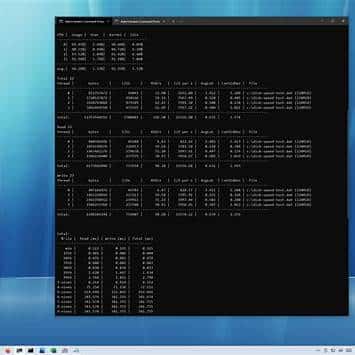
When a VPS feels slow, disk latency is often the culprit (databases, antivirus scanning, logs, backups). Use DiskSpd to measure IOPS, throughput, and latency. Run tests on a data disk if possible, not on the OS volume during production peak.
Example test (64K blocks, 8 threads, queue 32, 40% writes, 180 sec). Replace D: with a suitable volume:
diskspd.exe -c10G -d180 -Sh -L -o32 -t8 -b64K -w40 D:diskspd-test.datRead-heavy test example:
diskspd.exe -c10G -d180 -Sh -L -o32 -t8 -b64K -w0 D:diskspd-test.datFocus on AvgLat (ms), IOPS, and MiB/s. In many real workloads, consistent latency under load is more important than peak throughput.
If disk graphs are missing in Task Manager on older systems, enable disk performance counters and reopen Task Manager:
diskperf -yOn some Windows + virtualization combinations, network offloads can cause weird throughput drops, packet coalescing issues, or CPU spikes. Don’t “blindly disable everything” — check settings and test changes step-by-step.
Check current state:
Get-NetAdapter | Select-Object Name, Status, LinkSpeed

# RSC (Receive Segment Coalescing)
Get-NetAdapterRsc

# VMQ (Virtual Machine Queue)
Get-NetAdapterVmq

# RSS (Receive Side Scaling)
Get-NetAdapterRss
Common safe troubleshooting step: disable RSC/VMQ on some setups (test before/after):
# Replace "Ethernet" with your adapter name
Disable-NetAdapterRsc -Name "Ethernet"
Disable-NetAdapterVmq -Name "Ethernet"
LSO settings differ by driver. First list advanced properties and search for “Large Send Offload”:
Get-NetAdapterAdvancedProperty -Name "Ethernet" | Format-Table -AutoThen you can disable LSO (names may vary by NIC/driver):
Set-NetAdapterAdvancedProperty -Name "Ethernet" -DisplayName "Large Send Offload v2 (IPv4)" -DisplayValue "Disabled"
Set-NetAdapterAdvancedProperty -Name "Ethernet" -DisplayName "Large Send Offload v2 (IPv6)" -DisplayValue "Disabled"
After each change: measure using PerfMon and real traffic (RDP, SMB copy, iperf if you use it) to confirm improvement.
Antivirus scanning can throttle disk I/O (especially for databases, logs, caches). For workloads like SQL Server, IIS, or heavy logs, add exclusions carefully.
Example for Microsoft Defender (edit paths/processes to match your server):
# Exclude busy data folders (examples)
Add-MpPreference -ExclusionPath "D:SQLData"
Add-MpPreference -ExclusionPath "E:SQLLogs"
Add-MpPreference -ExclusionPath "F:SQLBackups"
Add-MpPreference -ExclusionPath "C:inetpubwwwroot"

# Exclude critical processes (examples)
Add-MpPreference -ExclusionProcess "sqlservr.exe"
Add-MpPreference -ExclusionProcess "w3wp.exe"
Keep exclusions minimal: exclude only “hot” data paths and core processes you trust.
As a baseline, avoid running at 95–100% RAM usage constantly. Leave headroom for filesystem cache and OS activity (many admins target ~15–20% headroom, depending on workload).
Pagefile: “System managed” is usually the safest default on VPS. If you need full crash dumps, size accordingly.
# Check current pagefile settings
wmic pagefile list /format:listHealth warnings are a strong signal to migrate before an incident (or to request storage replacement in dedicated environments).
# Quick status (may be limited in some virtualized environments)
wmic diskdrive get model,status

# If available:
Get-PhysicalDisk | Select-Object FriendlyName, MediaType, HealthStatus, OperationalStatusIf PerfMon confirms that CPU is pegged, RAM is consistently exhausted, or disk latency stays high under normal load, the most reliable fix is often more resources and faster storage. Consider upgrading your Windows VPS or selecting a higher-tier plan from our VPS hosting lineup for stable performance.